Data trends and patterns are important for business decisions because they can help organizations understand what is happening in their industry and what customers want.
By analyzing data, businesses can identify patterns and trends that will help them make better decisions about products, services, and marketing.
Data trends can also help businesses understand how their industry is changing and what new opportunities or threats might be emerging.
Linear Trend
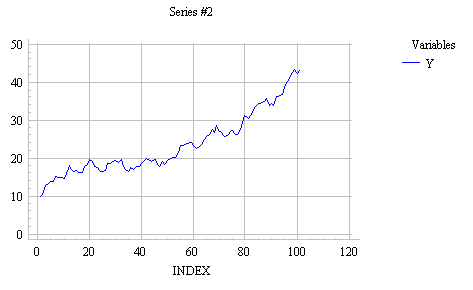
One of the most common patterns in data is linearity. A linear pattern is a continuous decrease or increase in numbers over time. Most often, this trend can be explained by a straight line on a graph. There are several reasons why a linear trend might exist. The most common one is simple arithmetic progression, where each number is the sum of the previous two. Other causes could be physical phenomena such as gravity or radiation, or social trends such as population growth.
Exponential Trend
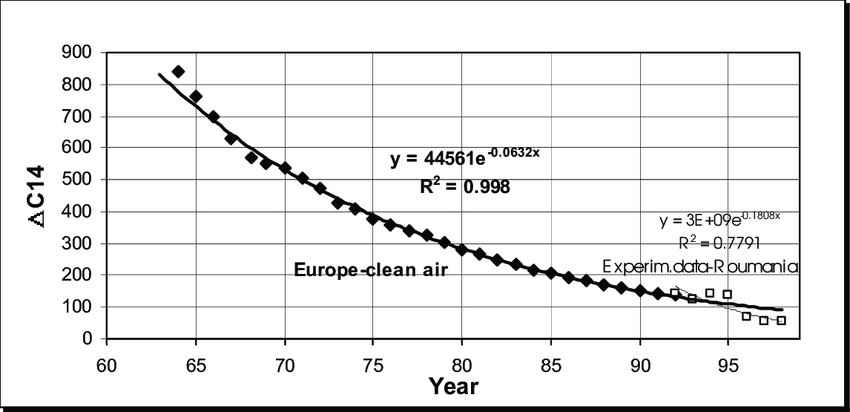
The exponential trend is a technique used to graphically represent data that doesn’t rise or fall at a steady rate, but at a higher rate. This trend is helpful in identifying trends and patterns in data that might not be apparent when the data is graphed linearly. The exponential trend produces non-linear curved lines where the data rises or falls, not at a steady rate, but at a higher rate.
Damped Trend
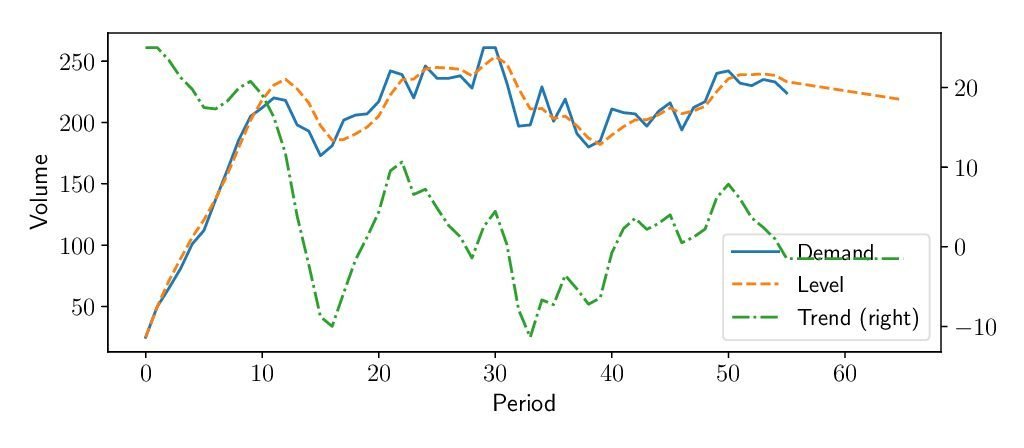
The damped trend is a graphical representation of data values that rise or fall at first, and then show a point where the trend (increase or decrease) stops rising or falling. The damped trend line can be used to help visualize changes in data over time. The line is curved to show that the data values are not always consistent, and the trend is not always linear.
Seasonality
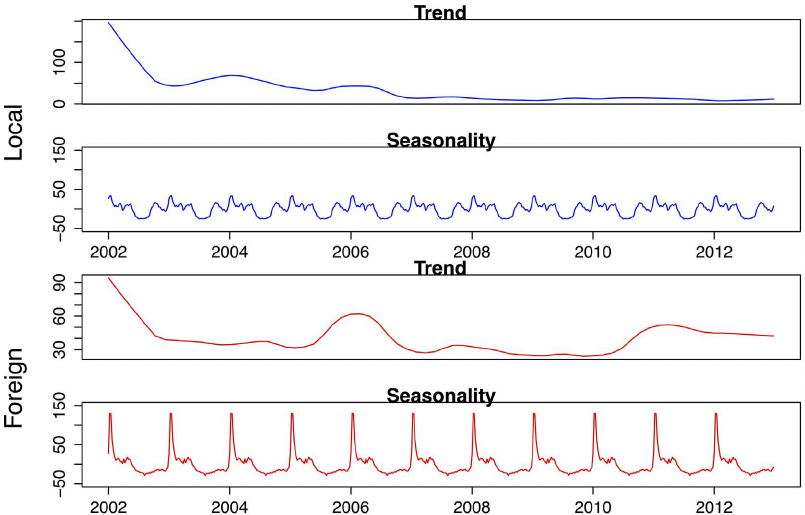
Seasonality is often found in economic indicators, reflecting the cyclical nature of some sectors of the economy. Many businesses and industries have sales and production cycles that follow a seasonal pattern. Seasonal patterns exist in retail sales, manufacturing, construction, and other areas of the economy.
Also Read: What are Learning Management Systems: Advantages and Features
The pattern of fluctuations that repeat over fixed periods of time and are predictable is what we define as seasonality. And while these patterns don’t always extend beyond a one-year period, they can have a profound impact on various aspects of the business – from sales and inventory to employee productivity.
Irregular/Random Patterns
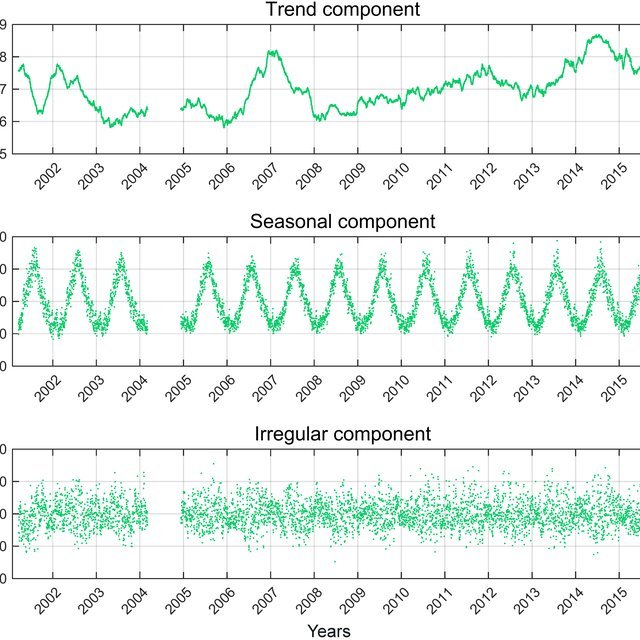
Irregular or random patterns can be found in all types of data, but are particularly common in time-series data. This type of analysis reveals fluctuations in a time series.
These fluctuations are short in duration, erratic in nature, and follow no regularity in the occurrence pattern.
While they may appear to be random, there is usually some underlying cause that is causing them.
Stationary/Stationarity
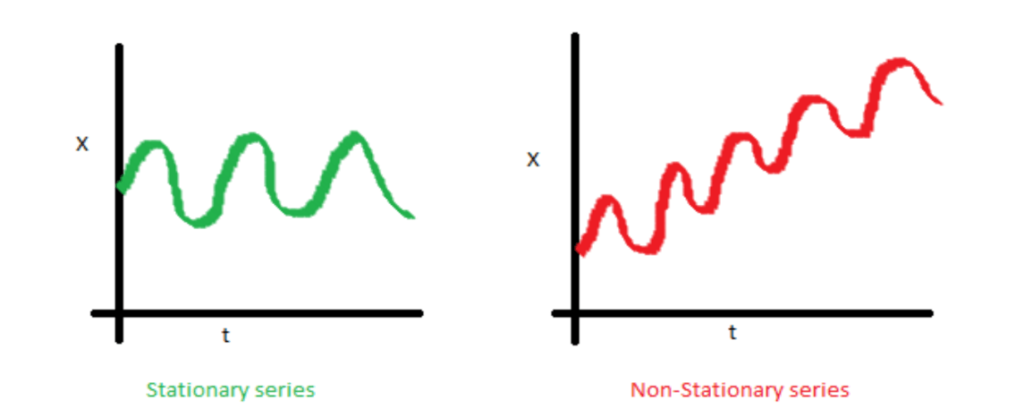
A stationary time series is one with statistical properties such as mean, where variances are all constant over time.
Stationarity is a desirable property for many time series analysis techniques. A series that is not stationary can be made stationary through differencing, which takes the difference of each data point from the previous one.
However, this technique can only be used once, and after differencing, the series must still be statistically stationary.
Cyclical Patterns
Cyclical patterns are found in many different aspects of life. Most notably, they can be found in the stock market, where stock prices rise and fall over time. Cycles can also be seen in the weather, with different seasons occurring at different times of the year.
It is important to be aware of cyclical patterns when making decisions that will affect your life.
How do they impact business decisions?
The world of business is constantly changing. Trends and patterns in data can help businesses make better decisions about what products to sell, how to market them, and where to open new locations.
Data analysts use various methods to examine data trends and patterns in order to help businesses make informed decisions.
Conclusion
Data trends and patterns impact business decisions by providing insights that can help businesses make more informed decisions.
By understanding how data trends and patterns are developing, businesses can adjust their plans and strategies accordingly to stay ahead of the competition.
Additionally, data analytics can help identify opportunities and areas for improvement, making businesses more efficient and profitable.
Thus, data trends and patterns are an essential part of making sound business decisions.